Guide · 9 min read ·
How Much Do Solar Panels Cost in the UK? 2026 Price Guide
Every price in this guide comes from the government's own record of what people actually paid, not from anyone's sales pitch.
At a glance
- Average cost of a home solar install
- £1,772 per kW
- Systems up to 4 kW
- £1,955 per kW
- Systems between 4 kW and 10 kW
- £1,645 per kW
- Systems over 10 kW
- £1,323 per kW
- A typical 4.5 kWp system
- around £7,600
- Cheapest region
- Wales, £1,646 per kW
- Dearest region
- London, £1,899 per kW
- Change in the last year
- down about 5%
- VAT until 31 March 2027
- 0%, then 5%
Cost figures: Department for Energy Security and Net Zero, Solar PV Cost Data 2025/26, published 28 May 2026, drawn from 177,014 domestic installations.
The quick answer
In 2025/26 the average home solar installation in the UK cost £1,772 for every kilowatt of system fitted.
Smaller systems cost more per kilowatt than larger ones. Up to 4 kW the average was £1,955 per kW. Between 4 kW and 10 kW, which covers most family homes, it was £1,645 per kW. Above 10 kW it dropped to £1,323 per kW.
So a 4 kW system came in at around £7,800 on average, and a 6 kW system at around £9,900.
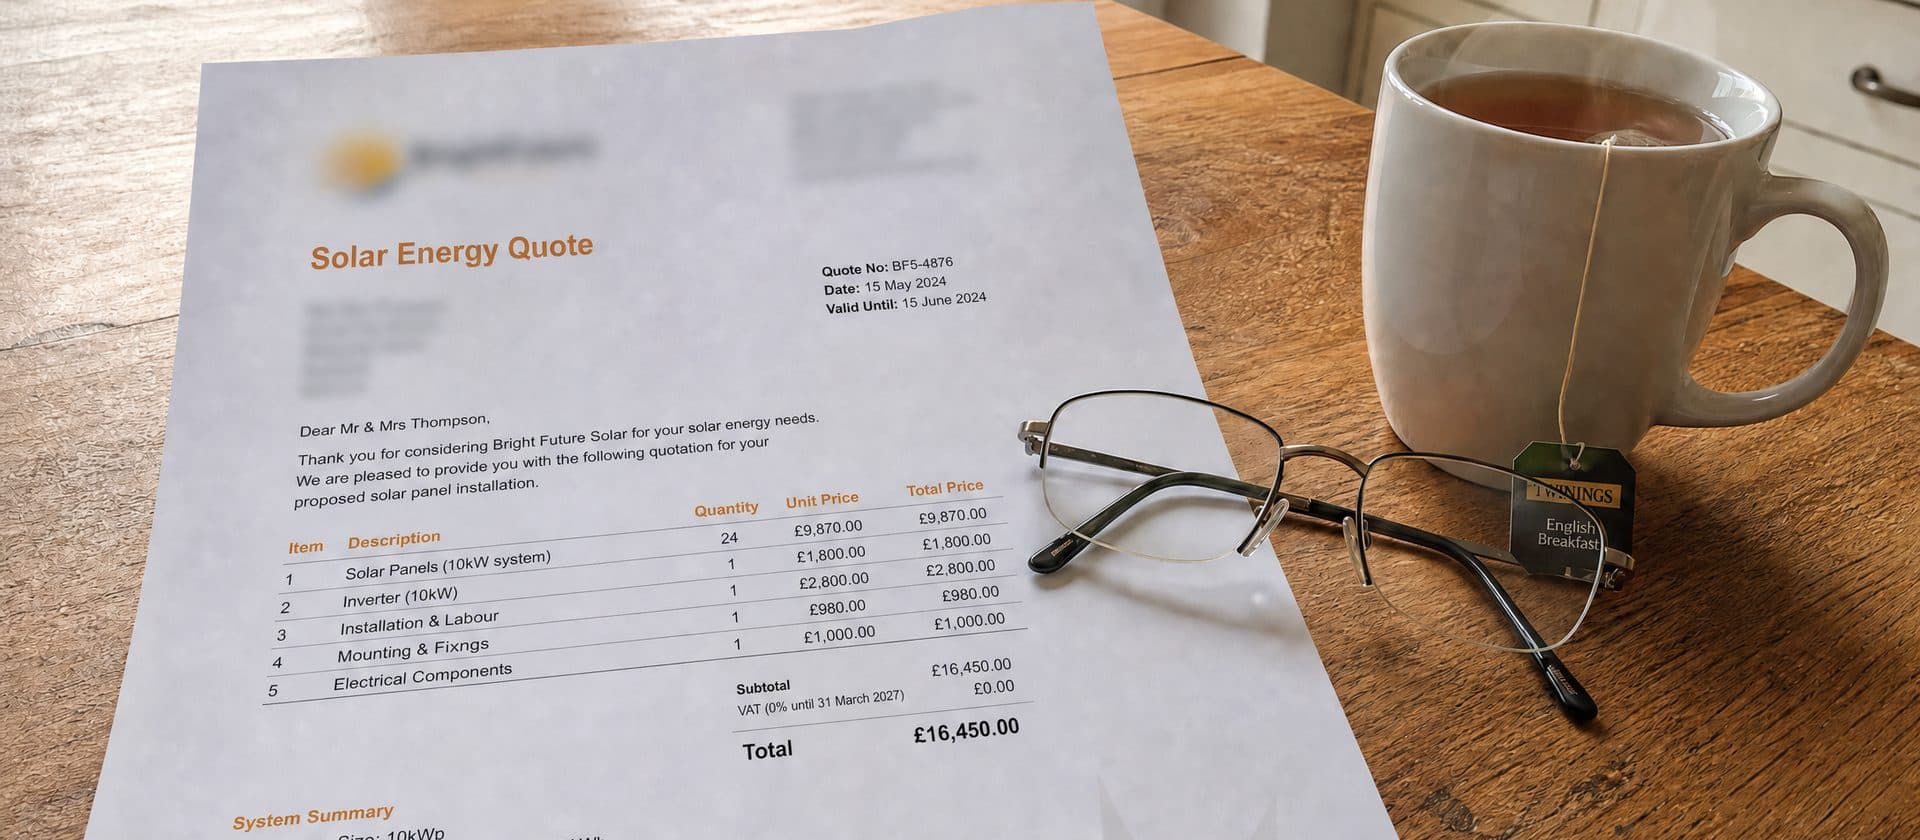
You open the email or letter and see the quote at the bottom. It is a bigger number than you expected.
You scroll back up, trying to work out whether they have added something you did not ask for, or whether this is simply what solar costs now.
You look at the total again. You look at the system size. You try to decide, on your own, whether it is fair.
This guide is for that moment.
See where your own roof lands in that range
See What Solar Would Cost Your Home90 seconds · Free · No home visitWhere these numbers come from
Most solar cost guides quote a number and leave you to trust it. Here is exactly where these came from, so you can check them yourself.
The Department for Energy Security and Net Zero publishes a dataset called Solar PV Cost Data. It is built from the MCS Installation Database, which records every certified small scale renewable installation in the country. The most recent release came out on 28 May 2026 and covers the 2025/26 financial year.
It is not a survey and it is not a sample. It covers 177,014 domestic installations, close to every certified install in the UK that year. It is what people actually paid.
One thing to know before you use it. The government publishes the same data two ways, and the two give different answers.
- Total Installed Capacity is the size of the panels on the roof.
- Declared Net Capacity is the maximum the system can push to the grid, which is lower.
Divide the same price by a smaller number and you get a bigger figure per kilowatt. That is why you will see solar costs quoted as anything from £1,600 to £2,000 per kW depending on which version somebody picked up.
When an installer quotes you a 5 kW system, they almost always mean the panels. So the figures in this guide use Total Installed Capacity, because that is the one that matches your quote.
What you are actually paying for
Most quotes arrive as a single number. Behind that number, the installer is paying for a list of parts and a list of jobs.
The panels are the obvious part. These are the dark rectangles you see on the roof. Each panel turns sunlight into electricity. A typical home system uses somewhere between 10 and 25 panels.
The inverter is the quiet box that sits on a wall, usually in a loft, garage or utility room. It turns the power from the panels into the type of electricity your home wiring and appliances use.
Mounting is all the metal work that holds the panels to the roof. On a tiled roof, that usually means brackets fixed to the rafters and rails that run across the roof for the panels to clip onto.
Wiring covers all the cabling that joins the panels together, links them to the inverter and then connects the inverter back to your main fuse board. There are also isolator switches so that the system can be turned off safely if work ever needs doing.
Labour is the time the fitting team spends on your home. That includes both the roof team and the electrician.
Scaffolding is what makes it safe to work on your roof. Even on a simple house, a scaffold tower or full run is normally needed. This is often from a separate company, arranged by the installer.
Certification and paperwork covers the checks and registrations that need to happen at the end. For most homes this includes MCS certification, a handover pack, notifying your energy supplier and confirming that the system meets grid rules so you can be paid for any electricity you export.
A good quote will name each of these items in some form, even if it does not put a separate price next to each one. This is the first thing to check when you compare two quotes, because they are not always built the same way. Some price the equipment and add the fitting separately. Some leave scaffolding out and bring it back in later. Before you compare two totals, check they cover the same list.
Why bigger systems cost less per panel
Look at the three figures side by side and the pattern is clear.
| System size | Average cost per kW |
|---|---|
| Up to 4 kW | £1,955 |
| 4 kW to 10 kW | £1,645 |
| Over 10 kW | £1,323 |
A system over 10 kW costs about a third less per kilowatt than a small one. That is not a discount anyone is giving you. It is because a lot of a solar job costs the same whatever the size.
The scaffolding still goes up. The team still travels to site. The electrician still connects to the fuse board. The paperwork and certification are the same. Spread those fixed costs over more panels and the figure per kilowatt comes down.
It is worth knowing if you are weighing up whether to fit a few more panels than you strictly need. The extra ones are usually the cheapest on the roof.
Where you live makes less difference than you think
This one surprised us.
There is a common assumption that everything costs more away from the big cities, or that the north pays a premium for tradespeople travelling further. The government data does not support it.
| Region | Average cost per kW |
|---|---|
| London | £1,899 |
| South East | £1,766 |
| East Midlands | £1,744 |
| South West | £1,739 |
| North West | £1,714 |
| Yorkshire and The Humber | £1,709 |
| East of England | £1,708 |
| West Midlands | £1,700 |
| North East | £1,696 |
| Scotland | £1,693 |
| Wales | £1,646 |
The North West, which includes Cumbria, sits mid-table at £1,714 per kW. That is below the South East and well below London. The North East and Scotland are cheaper still, and Wales is the cheapest part of the UK.
The gap between the dearest region and the cheapest is about 15 percent. Real, but not the gulf people expect. London is the outlier, not the north.
So if you own a home in Cumbria, a quote that looks high against a national average is not high because of where you live. It is worth asking what else is driving it.
Get the figure for your own roof, then run the same check
See What Solar Would Cost Your Home90 seconds · Free · No home visitPrices have been coming down
The same dataset going back a few years shows a clear direction.
For a system between 4 kW and 10 kW, the average cost per kilowatt was £1,738 in 2024/25 and £1,645 in 2025/26. That is a drop of roughly 5 percent in a year, and the fall has been going on longer than that.
There is one thing pulling the other way. The 0% VAT rate on domestic solar runs until 31 March 2027 and is then due to return to 5%.
So the equipment has been getting cheaper while the tax on it is about to go up. Whether those two cancel each other out is anyone's guess, and nobody should pretend otherwise. Just be aware that both are moving.
Cost per kW, the shortcut to spotting a fair quote
Cost per kW means taking the total price of the system and dividing it by the system size in kilowatts. It gives you one figure you can compare against every table above, whatever the total.
Take the total including VAT, divide it by the system size in kW, and see where it lands.
If your quote works out well above the figure for its size band, ask what is driving it. There may be a complex roof, difficult access, or a branded component that genuinely costs more. There may also be simple margin. Either way you are entitled to an answer.
If it works out well below, ask what has been left out. Sometimes a very low quote is missing scaffolding, bird protection, or any allowance for a future inverter replacement.
That one calculation takes about ten seconds and it is the most useful thing you can do with a quote you are unsure about.

In-roof panels, and what they add
Most domestic systems sit on top of your existing tiles using brackets and rails. This is called on-roof.
In-roof systems are different. The panels sit flush with the surrounding tiles and take the place of the tiles in that part of the roof. Many people choose in-roof for the look, especially on new builds and re-roofs.
In-roof systems cost more, because there is more roofing work and more waterproofing detail involved. How much more depends on the size of the array and the roof itself, so it is worth asking for both options priced separately if you are undecided.
In-roof can make sense if you are already changing the roof or building from scratch. On an existing tiled roof in good condition, on-roof is often the simpler and cheaper choice.
What pushes the price up or down
Two homes with the same number of panels can attract very different quotes. The reason is usually the roof and the access.
Roof type matters. Slate takes more care and more time than concrete tiles. Some older roofs need extra work under the tiles before anyone is happy to fix brackets to them.
Access makes a difference too. A simple front elevation on a wide pavement is easier to scaffold than a tall terrace tucked behind a narrow lane. If the scaffold firm needs extra labour or a more complex design, that shows up in the price.
How far the main fuse board is from the panels affects the amount of wiring and the time on site. A short run from the loft to a downstairs cupboard is one thing. A long, awkward route around extensions and through finished rooms is another.
The shape and orientation of the roof can increase the fitting time as well. One big, clear rectangle facing a good direction is quicker to work on than several small planes broken up by chimneys and dormers.
All of these are legitimate reasons for a quote to sit above or below the average. They are worked out on survey and they are specific to your home. It is fine to ask what in your property is pushing the figure.
Turn a rough quote into a figure for your actual roof
See What Solar Would Cost Your Home90 seconds · Free · No home visitBatteries, and what they add
Many homeowners now pair panels with a battery, so they can store spare solar energy during the day and use it in the evening.
Battery costs vary widely with capacity and are usually quoted separately from the panels, so ask for them broken out rather than folded into one total.
Whether a battery makes sense for you depends on how you use electricity across the day and what export and import tariffs you have available. That deserves its own guide, which is why batteries are covered in more depth elsewhere.
0% VAT, and the deadline
Right now, domestic solar in the UK carries 0% VAT.
That means you are not paying VAT on the panels, the inverter or the other parts of a straightforward home install. On a typical system, this is worth roughly £1,000 to £2,000 compared with paying the normal rate.
This is the closest thing the UK currently has to a direct rebate on solar. It also has a clear end date.
The 0% rate is scheduled to run until 31 March 2027. After that, it is due to return to 5%. There is more on how the zero rate works in our guide to 0% VAT on solar.
If you are taking your time to research, that is fair. Just be aware that there is a line in the sand on the tax treatment.
What comes back the other way
So far this has been all about money going out. What brings money back towards you once the system is on the roof?
There are two main streams. Bill savings and export income.
Bill savings come from using your own solar power in place of buying electricity from the grid. Every unit you use from your roof is a unit you do not pay your supplier for.
Export income comes from selling spare power back to the grid when you are making more than you are using. Most suppliers now offer a fixed rate per unit under a scheme called the Smart Export Guarantee. The rate varies a lot between suppliers, and that is worth knowing before you sign anything, because staying on the wrong tariff can cost you more than a hundred pounds a year in lost export income.
For a smaller system generating about 3,400 kWh a year, which is a common size in this part of the country, the typical picture is a bill saving of roughly £200 to £400 a year and export income of roughly £150 to £300 a year.
These are broad figures to give a sense of scale. They assume an average use pattern and average tariffs for a system of that size. A larger system generates more, so it would not carry these same figures.
What those numbers are not is a payback period. They are simply what tends to come back each year for a system of that size under typical use.
Find out what the annual picture could look like for your roof
See What Solar Would Cost Your Home90 seconds · Free · No home visitA worked example
To keep everything tied to real numbers, here is a simple worked example using the smaller system mentioned above.
Imagine a system that generates about 3,400 kWh a year. That is a common output for a smaller array in this part of the country. Out of that, you might use a good share of the power directly in the home as it is generated. The rest goes back to the grid and earns export income.
| Each year | Amount |
|---|---|
| Saved on bills, by buying fewer units | £200 to £400 |
| Earned from exporting spare power | £150 to £300 |
| Moving in your favour | £350 to £700 |
The exact numbers for any one home will depend on how much electricity you use, when you use it, and what your import and export rates are. That is why it is important to see any worked example as a way of understanding the moving parts, not as a promise.
Costly mistakes to avoid
- Focusing on the headline price instead of the cost per kW. The single quickest way to compare quotes is to divide the price by the system size.
- Comparing a small system against a big system's cost per kW. A 3 kW system will always look dear next to a 12 kW one. Compare within the same size band.
- Comparing quotes that are not for the same thing. Check that the panel count, inverter size, and any battery storage match before you look at the totals.
- Ignoring the export rate. A low export tariff can take hundreds of pounds off the annual benefit of a system without you noticing.
- Accepting a quote that does not itemise the main parts. If you cannot see what is included, it is hard to know what you are really buying.
- Assuming the cheapest quote is the same system as the dearest one. Often the cheapest has dropped panel quality, inverter brand, or support.
- Overlooking scaffold and access assumptions. A quote that does not spell out what is allowed for access can later grow if the scaffold turns out to be complex.
- Treating a sales projection as a guarantee. Savings and export figures are estimates, not promises. Use them to sense check, not to plan your last pound.
What to ask before you sign anything
- What is the total system size in kW, and what is the cost per kW once VAT is included?
- Is that system size the panel capacity or the declared net capacity?
- Is this a fitted price, or the price of the equipment with the fitting added separately?
- Does your price include all scaffolding, access equipment and making good afterwards?
- Exactly how many panels are included, and what make and model are they?
- What inverter are you using, what size is it, and what is its warranty length?
- What export rate can I realistically expect, and which suppliers are currently offering it?
- Who will handle the MCS certification and all the paperwork with my energy supplier?
- If I have a problem in future, who do I contact and how long do you aim to respond?
These are straightforward questions any good installer should be happy to answer in plain language. The way they respond tells you as much as the answers themselves.
Common questions
Where do these figures come from?
The Department for Energy Security and Net Zero publishes Solar PV Cost Data, built from the MCS Installation Database. The most recent release covers the 2025/26 financial year and was published on 28 May 2026. It covers 177,014 domestic installations, so it is very close to a complete record rather than a sample.
Why do I see different cost per kW figures on different websites?
Usually because the government publishes the same data two ways. Total Installed Capacity is the size of the panels. Declared Net Capacity is the maximum the system can send to the grid, which is a smaller number, so dividing by it produces a higher cost per kW. This guide uses Total Installed Capacity because that is what matches the system size on your quote.
Does it cost more to have solar fitted in the north?
No. The North West averages £1,714 per kW against a South East figure of £1,766 and a London figure of £1,899. The North East, Scotland and Wales are cheaper still. London is the expensive outlier, not the north.
Are solar panel prices going up or down?
Down, so far. For systems between 4 kW and 10 kW the average fell from £1,738 per kW in 2024/25 to £1,645 in 2025/26. The 0% VAT rate ending on 31 March 2027 pushes the other way, so the two may partly cancel out.
What maintenance do solar panels need?
Panels have no moving parts. On most homes they need very little attention beyond an occasional check that nothing is shading them and that they stay reasonably clean. The inverter is the part most likely to need replacing during the system's life. Your installer should cover warranties and likely lifespans in the handover pack.
Will solar still work on cloudy days or in the north of England?
Solar panels generate in daylight, not only in strong sunshine. Output is higher on bright days, lower on dull days, but it rarely drops to zero in daytime. Northern areas see a little less total generation across the year than the sunniest parts of the south, but many homes still reach useful generation figures, which is what matters for your bills.
The bottom line
The government publishes what 177,014 households actually paid last year. Once you know the average for your size of system, and you can do the cost per kW sum, you can look at any quote and see where it stands.
You are then making a clear financial decision, based on your own roof, rather than reacting to a sales pitch.
Turn today's quote into a number you can judge with confidence
See What Solar Would Cost Your Home90 seconds · Free · No home visitCost figures throughout: Department for Energy Security and Net Zero, Solar PV Cost Data, 2025/26 financial year, published 28 May 2026, Total Installed Capacity basis. Typical system figure from the Energy Saving Trust. Renewable Robin is not an installer. We line homeowners up with vetted, MCS certified local installers.